Joe Kercsmar, CEDIK Research Associate
“Knocks” is an understatement. On March 7, 2016 the White House launched The Opportunity Project (United States Census Bureau, 2016), a collaboration with private companies to make the governmental data easily accessible and user-friendly. In Washington, D.C. a dozen private firms put on demonstrations of their technology-fueled and community-centered tools designed to improve the economic mobility for all Americans and aid communities in their ability to flourish. These twelve available tools use recently released Federal and local datasets and are currently heavily focused on eight major U.S. cities. Keep an eye out, because there are surely more tools to come. Note that not all tools will be readily usable for every state, or have data at the county or zip code level. However, the PolicyMap Opportunity Tool, Open Data Network, and Community Commons are notable and have features for use by nearly any community in Kentucky.
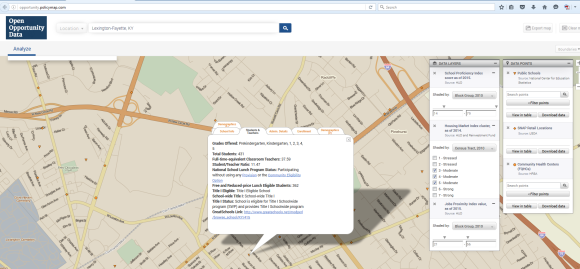
Gather your priorities, put them in order, and jump on PolicyMap Opportunity Tool (PolicyMap, 2016). Select up to three of your most important priorities, including housing, jobs, education, transportation, and demographics. Then the interactive map will layer the three categories and shade the areas where all criteria are satisfied.

Kentucky residents have the ability to add data points such as schools, grocery stores (including SNAP), and health facilities. Clicking on each icon provides the user with valuable information. For instance, school points have demographics, free and reduced lunch eligible data, and teacher ratio, as seen below. Grocery store points will have a pop-up indicating name, address, and whether it is a limited service (dollar store) or full-service (supermarket).
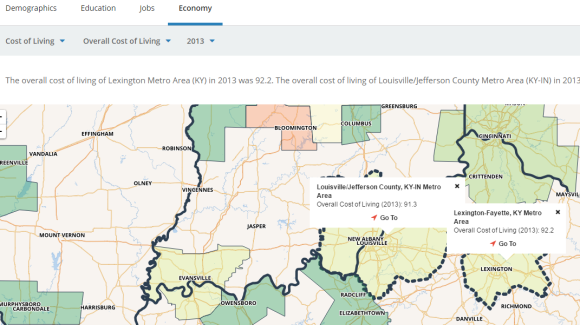
Where PolicyMap provides data at a community level with details regarding individual schools and stores, Open Data Network (Socrata, 2016) focuses on a bigger picture. Compare two geographic regions, whether it be cities, counties, metropolitan statistical areas, or bigger areas. In the following example Warren County and Pike County are compared by median earnings, but other options include employment rates, education expenditures, graduation rates, health behaviors, and population.

When selecting two Metropolitan Statistical Areas, the “Health” tab is replaced with “Economy” where either GDP or Cost of Living can be compared between regions. Perusing the Demographics, Education, Jobs, and Economy tabs will paint a broad picture of the differences and similarities of the selected areas. Locally, your chamber of commerce could use this tool to highlight their community’s strengths and improve weaknesses.
Another tool for finding areas of opportunity is the Community Commons site (IP3 and CARES University of Missouri, 2016). Here you can search previously created GIS maps based on “channels” including economy, education, health, food, equity, and environment. Below is an example of a map in the education channel, showing disengaged youth population for the selected area.

In the food channel, we can explore a map concentrating on students who are eligible for free and reduced lunches, as well as an overlay of the population in various poverty levels. The economy channel includes an informative map giving the 10-year percent change in labor force by county. In Kentucky’s circumstance, the map reveals that the largest decreases in labor force over the past ten years are in Eastern Kentucky and other rural areas, but labor force increased in most of the Metropolitan Statistical Areas. At the time of this writing, Community Commons had 288 maps available on the website to explore.
StreetWyze (Streetwyze, 2016) looks like it has the potential to be an app you can’t live without. They describe their tool as a ground-truthing neighborhood navigator powered by local knowledge. Although the StreetWyze app is not yet ready for the public, it is in beta and available by invitation. If you love your community, and you want to show everyone else what they are missing, then join StreetWyze. Map your area, tag pictures of the best places, and crowdsource information on several topics educating other information seekers, and get the word out about your neighborhood.

With the amount of information available, anyone could get lost in GIS maps for days. Happy exploring!
